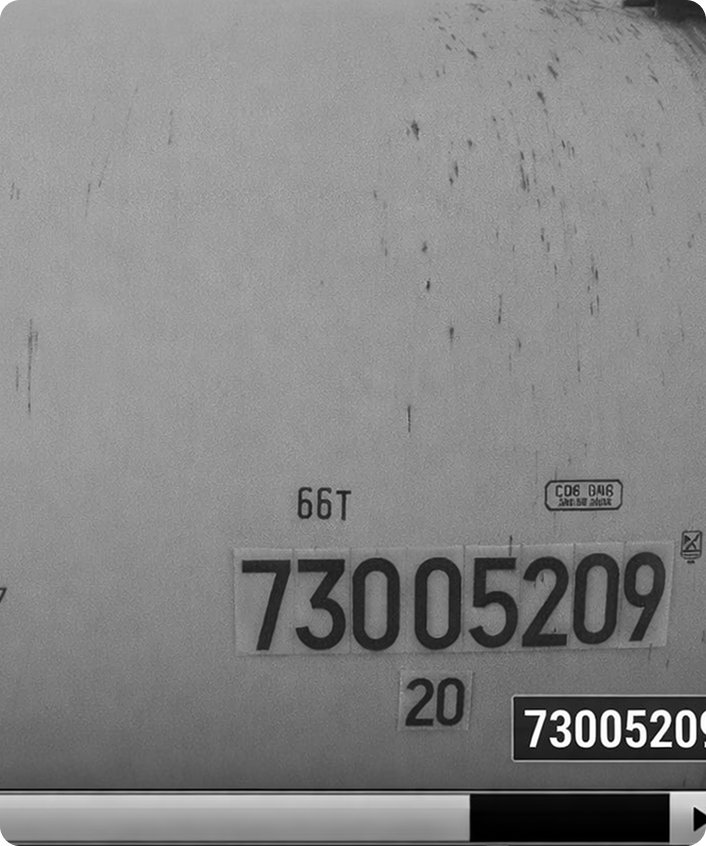
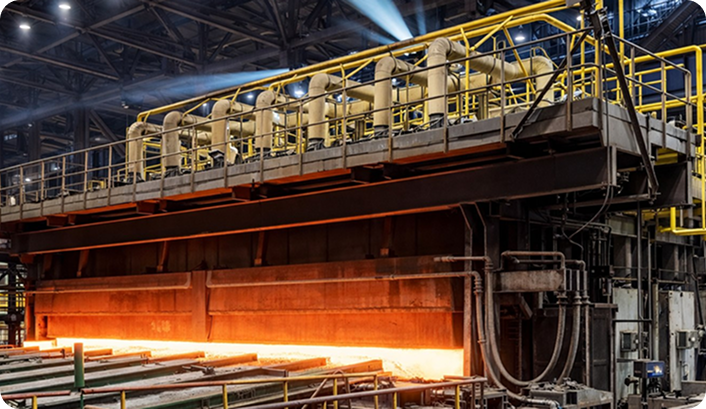
Detection of excessive atmospheric emissions at technological facilities
WORK PERFORMED
SYSTEM ALGORITHM
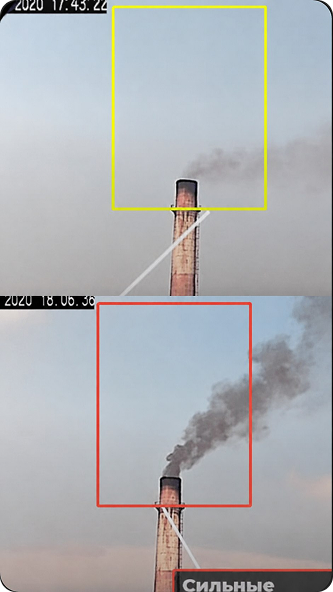
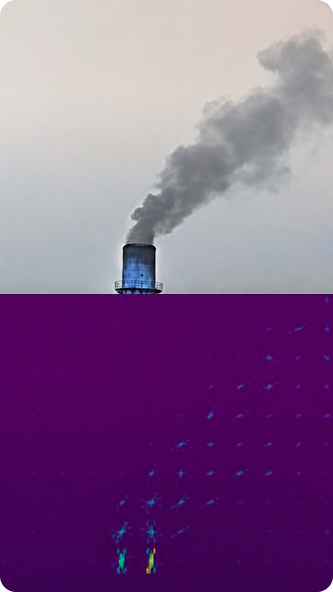
3 stages
Stage 1
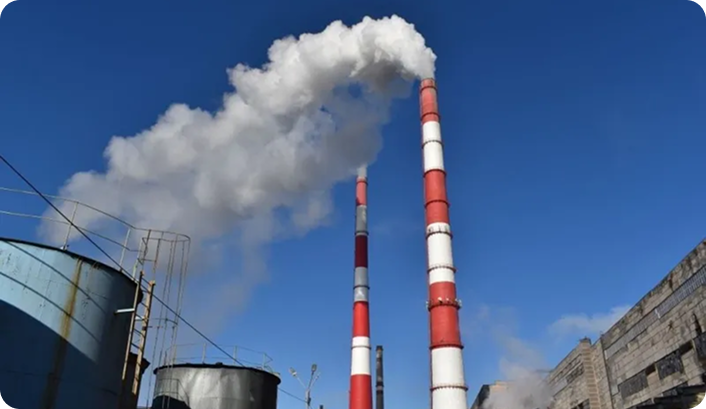
Regions of interest and the feature vector for excessive emissions are identified in the image.
Stage 2
The vector is fed into a trained neural network that determines the presence and intensity of emissions at production facilities.
Stage 3
Based on neural network data, a signal is generated and sent to the mimic diagram, where it is converted into a visual display.
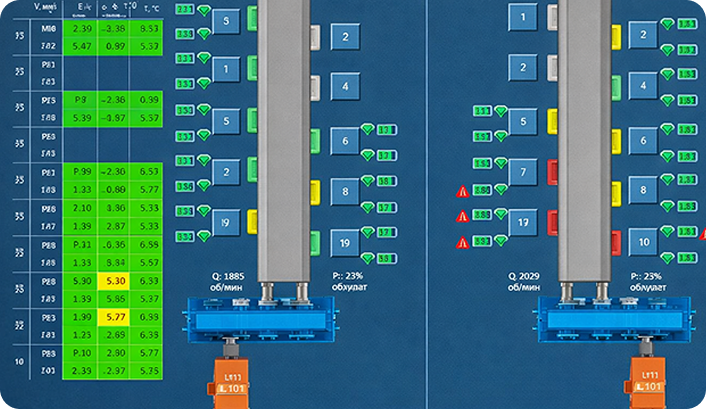
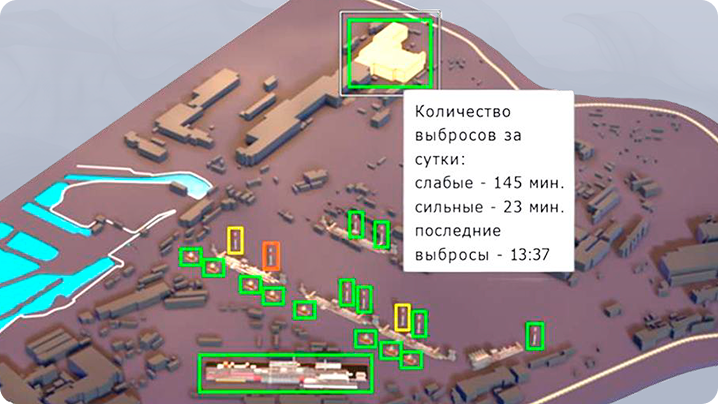
Mimic diagram overview
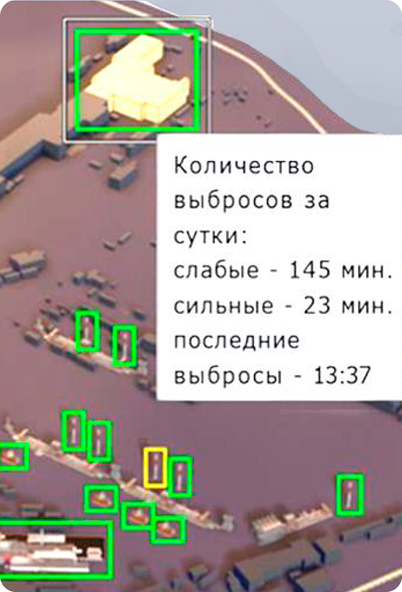
On the mimic diagram, the presence of signals from cameras and emissions at facilities are determined by color indication:
Green - no emissions
Yellow - weak emissions
Red - strong emissions
Gray - no signal from the camera
Hovering displays the time of recorded emissions.
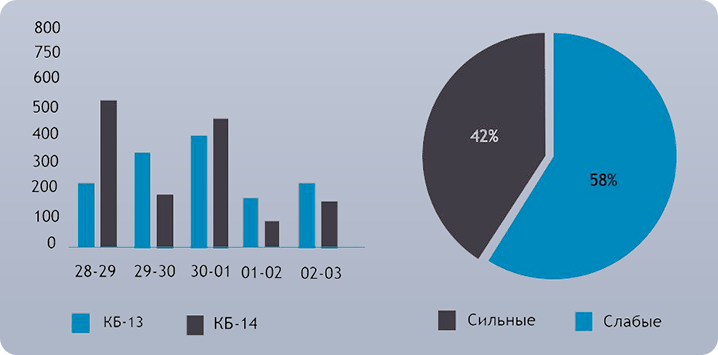
Report histogram
Based on reports received from the system, histograms are generated characterizing the presence and degree of emissions on the battery.
The general view allows for a quick summary of emissions per day for each object.
RESULTS